Walking through all these Parks
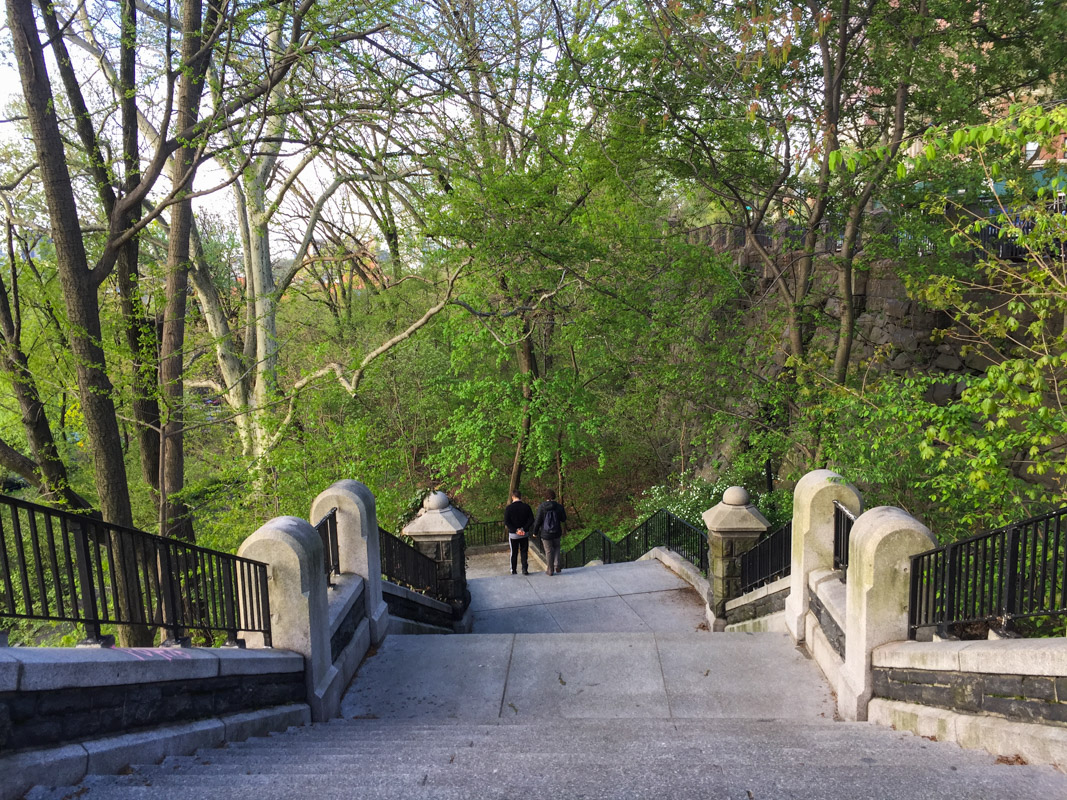
Ever since we moved here we have been frequent visitor to Morningside Park. We never actually spend time in the park though, it’s just a place we pass through while walking from the east side to the west side of Manhattan. It takes 30 minutes on a good day to do the trek from our apartment to Columbia University. And we get to pass through Marcus Garvey Park and the Mount Morris Park Historic District on the way too. There are no tall buildings like the ones you see downtown here. Well, there are a couple of tall houses but no real abundance of them. I usually go through the northern part of Morningside Park, but in the southern end there is even a beautiful waterfall! Maybe I’ll try to go by there this week.
Morningside Park Late April:


As I have mentioned earlier, I love stats, charts, documentation etc, and NYC has created this awesome 3D map of all the buildings in Manhattan, and you can color them by height. If you take a look at East Harlem you can see that the majority of buildings are 10-25 m and in central Harlem they get a bit taller but still below 50m (depending on the speed of your internet and power of your computer the 3D map might take a while to load). Of course there are a few taller ones, but its pretty eyeopening to see on a map like this.
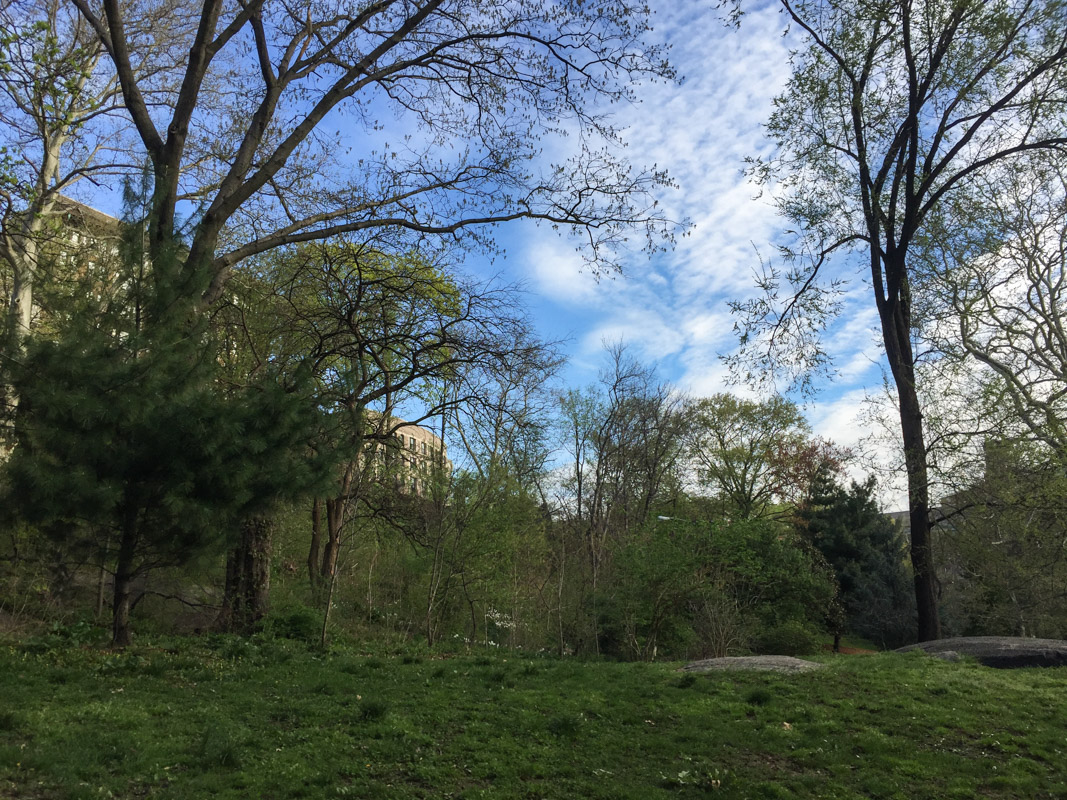
Marcus Garvey Park mid to late April:


If you are interested in the demographics of the greater NYC area you can take a look at this map pdf from NYC department of city planning, which also has all the different neighborhoods listed. What you might notice too, is how the topography changes as you move throughout the city. Walking from the east side to the westside through Morningside park you will walk up three sets of long stairs. If you look at the pdf map I just mentioned, you can clearly see that the west side lays at a higher elevation compared to the east side. You can also se the specific demographics for all the different larger neighborhoods by going to NYC planning. NYC planning also have some more detailed demographic facts about all the different neighborhoods if you are into that. In some way NYC is a large model city, there are ton of studies about anything in the city and Manhattan. Air pollution, water quality, green roofs, sustainability and the list goes on.
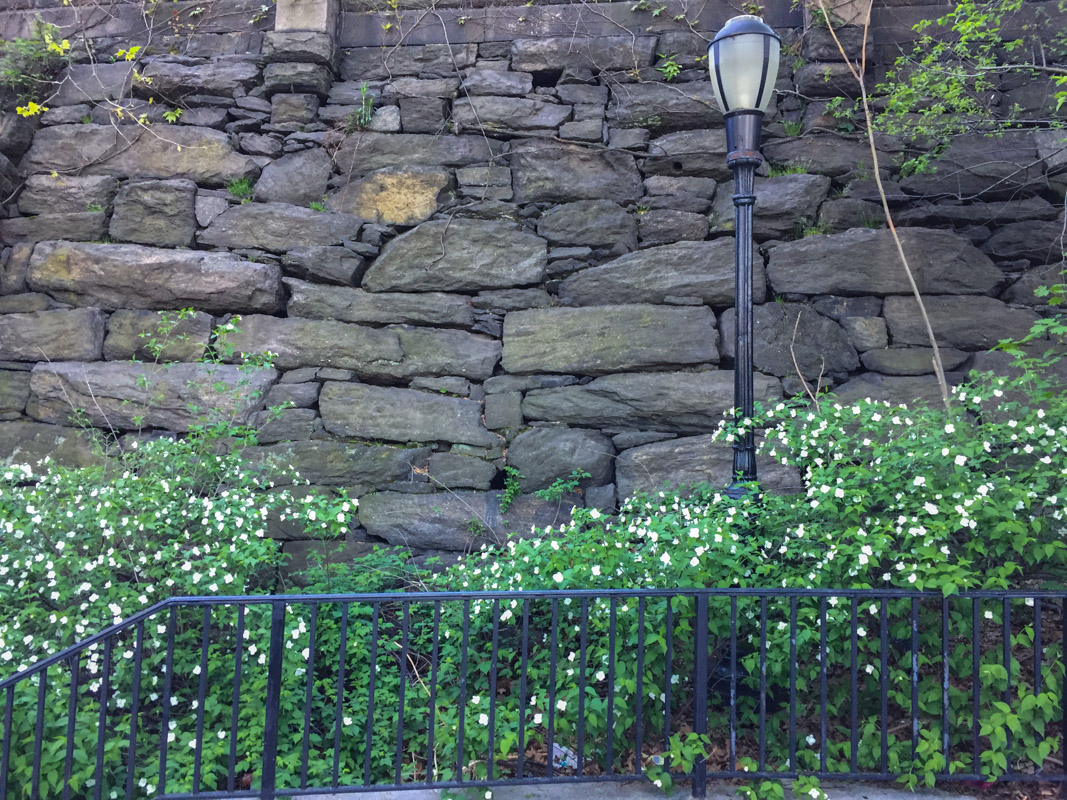
Mount Morris Park Historic District:


A couple of weeks ago I wrote about all the great maps and info you can get from NYC Parks and Central Park Conservancy. If you are interested in seeing what tree species you pass during your walk you can take a look at NYC Parks list of all trees in NYC, its quite incredible if you think about it. They have mapped every single tree in the city, of course there might be some lag if a tree dies or so. There you can also report if a tree needs attention by NYC Parks. You will be able to also click on a tree and see what species it is. It has a count for all the trees in the different neighborhoods and also how much CO2 the city is offsetting by having all of those trees! The map is also color coded if you zoom out, based on the number of trees, where darker green corresponds to a high number of trees, and lighter green to low. Does anyone know of similar maps in other cities?
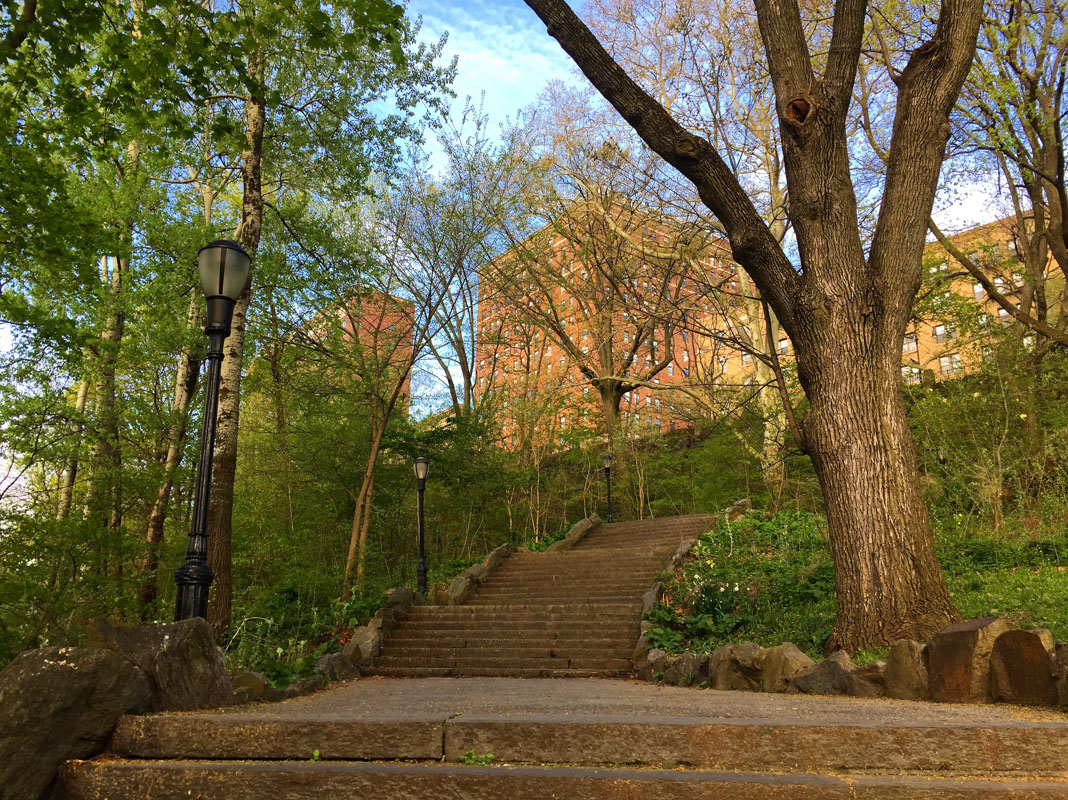
Morningside Park Late April: